

" height="38px" id="s7PhIa9un" transform="translate(30.212 21.908)" width="21px"/></svg>)
Turning Planetary Data into Visible Insights for Sustainable Manufacturing
" height="59.99999755566683px" id="MM6SLOagw" transform="translate(7 11) rotate(90 34.5 30)" width="69px"/></svg>)
Client
Planetary Insights
Role
Product Designer
Timeline
4 weeks
Planetary Insight is a climate-tech platform that helps manufacturers measure their environmental impact against the "Planetary Boundaries" framework. The original interface was a cluttered, engineer-focused dashboard that made critical data hard to interpret. I led the complete UI/UX overhaul, transforming a complex data entry tool into an intuitive insights hub. By streamlining the user flow and redesigning the visualization architecture.
Context
The Science of Sustainability - Manufacturers want to be sustainable, but they drown in data.
Planetary Insight allows companies to assess products against the ten "Planetary Boundaries"—from Carbon usage to Biodiversity loss. The goal is to tell a manufacturer exactly where their supply chain is breaking the planet's limits.

▲ Planetary boundaries
" height="59.99999755566683px" id="gXFm8DZHv" transform="translate(7 11)" width="69px"/></svg>)
Problem
Cognitive Overload -The original dashboard forced users to work for their insights.

▲ The legacy interface
The platform was suffering from low engagement. The technology was powerful, but the interface was blocking users from seeing the value.
Looking at the legacy interface, the usability issues were glaring:
" height="82px" id="D3F9kcYvK" width="82px"/></svg>)
Disjointed Visualization
The core "Radar Chart" was tiny and disconnected from the "Processes" bar charts on the right, making it impossible to correlate cause and effect.
The "Spreadsheet" Effect
Key metrics were buried in a dense table of raw numbers (e.g., "13.7g Waste") without visual context on whether that number was "good" or "bad."
Hidden Controls
Critical inputs (like "Daily" vs "2030" targets) were hidden in small, unlabelled dropdowns at the top, leading to user error.

▲ Design audit
Research & Exploration


▲ User Researches
To understand why users were getting stuck, I conducted task analysis on the existing platform. The results were brutal: users were taking an average of 8 minutes just to set up a single product assessment.
I mapped out the user journey and identified the bottleneck: the "Input" phase was completely separated from the "Result" phase. Users had to navigate back and forth blindly.


▲ Information architecture & early sketches
The Shift…
Solution
I redesigned the platform to act as a command center rather than a data entry form, supported by a scalable design architecture.


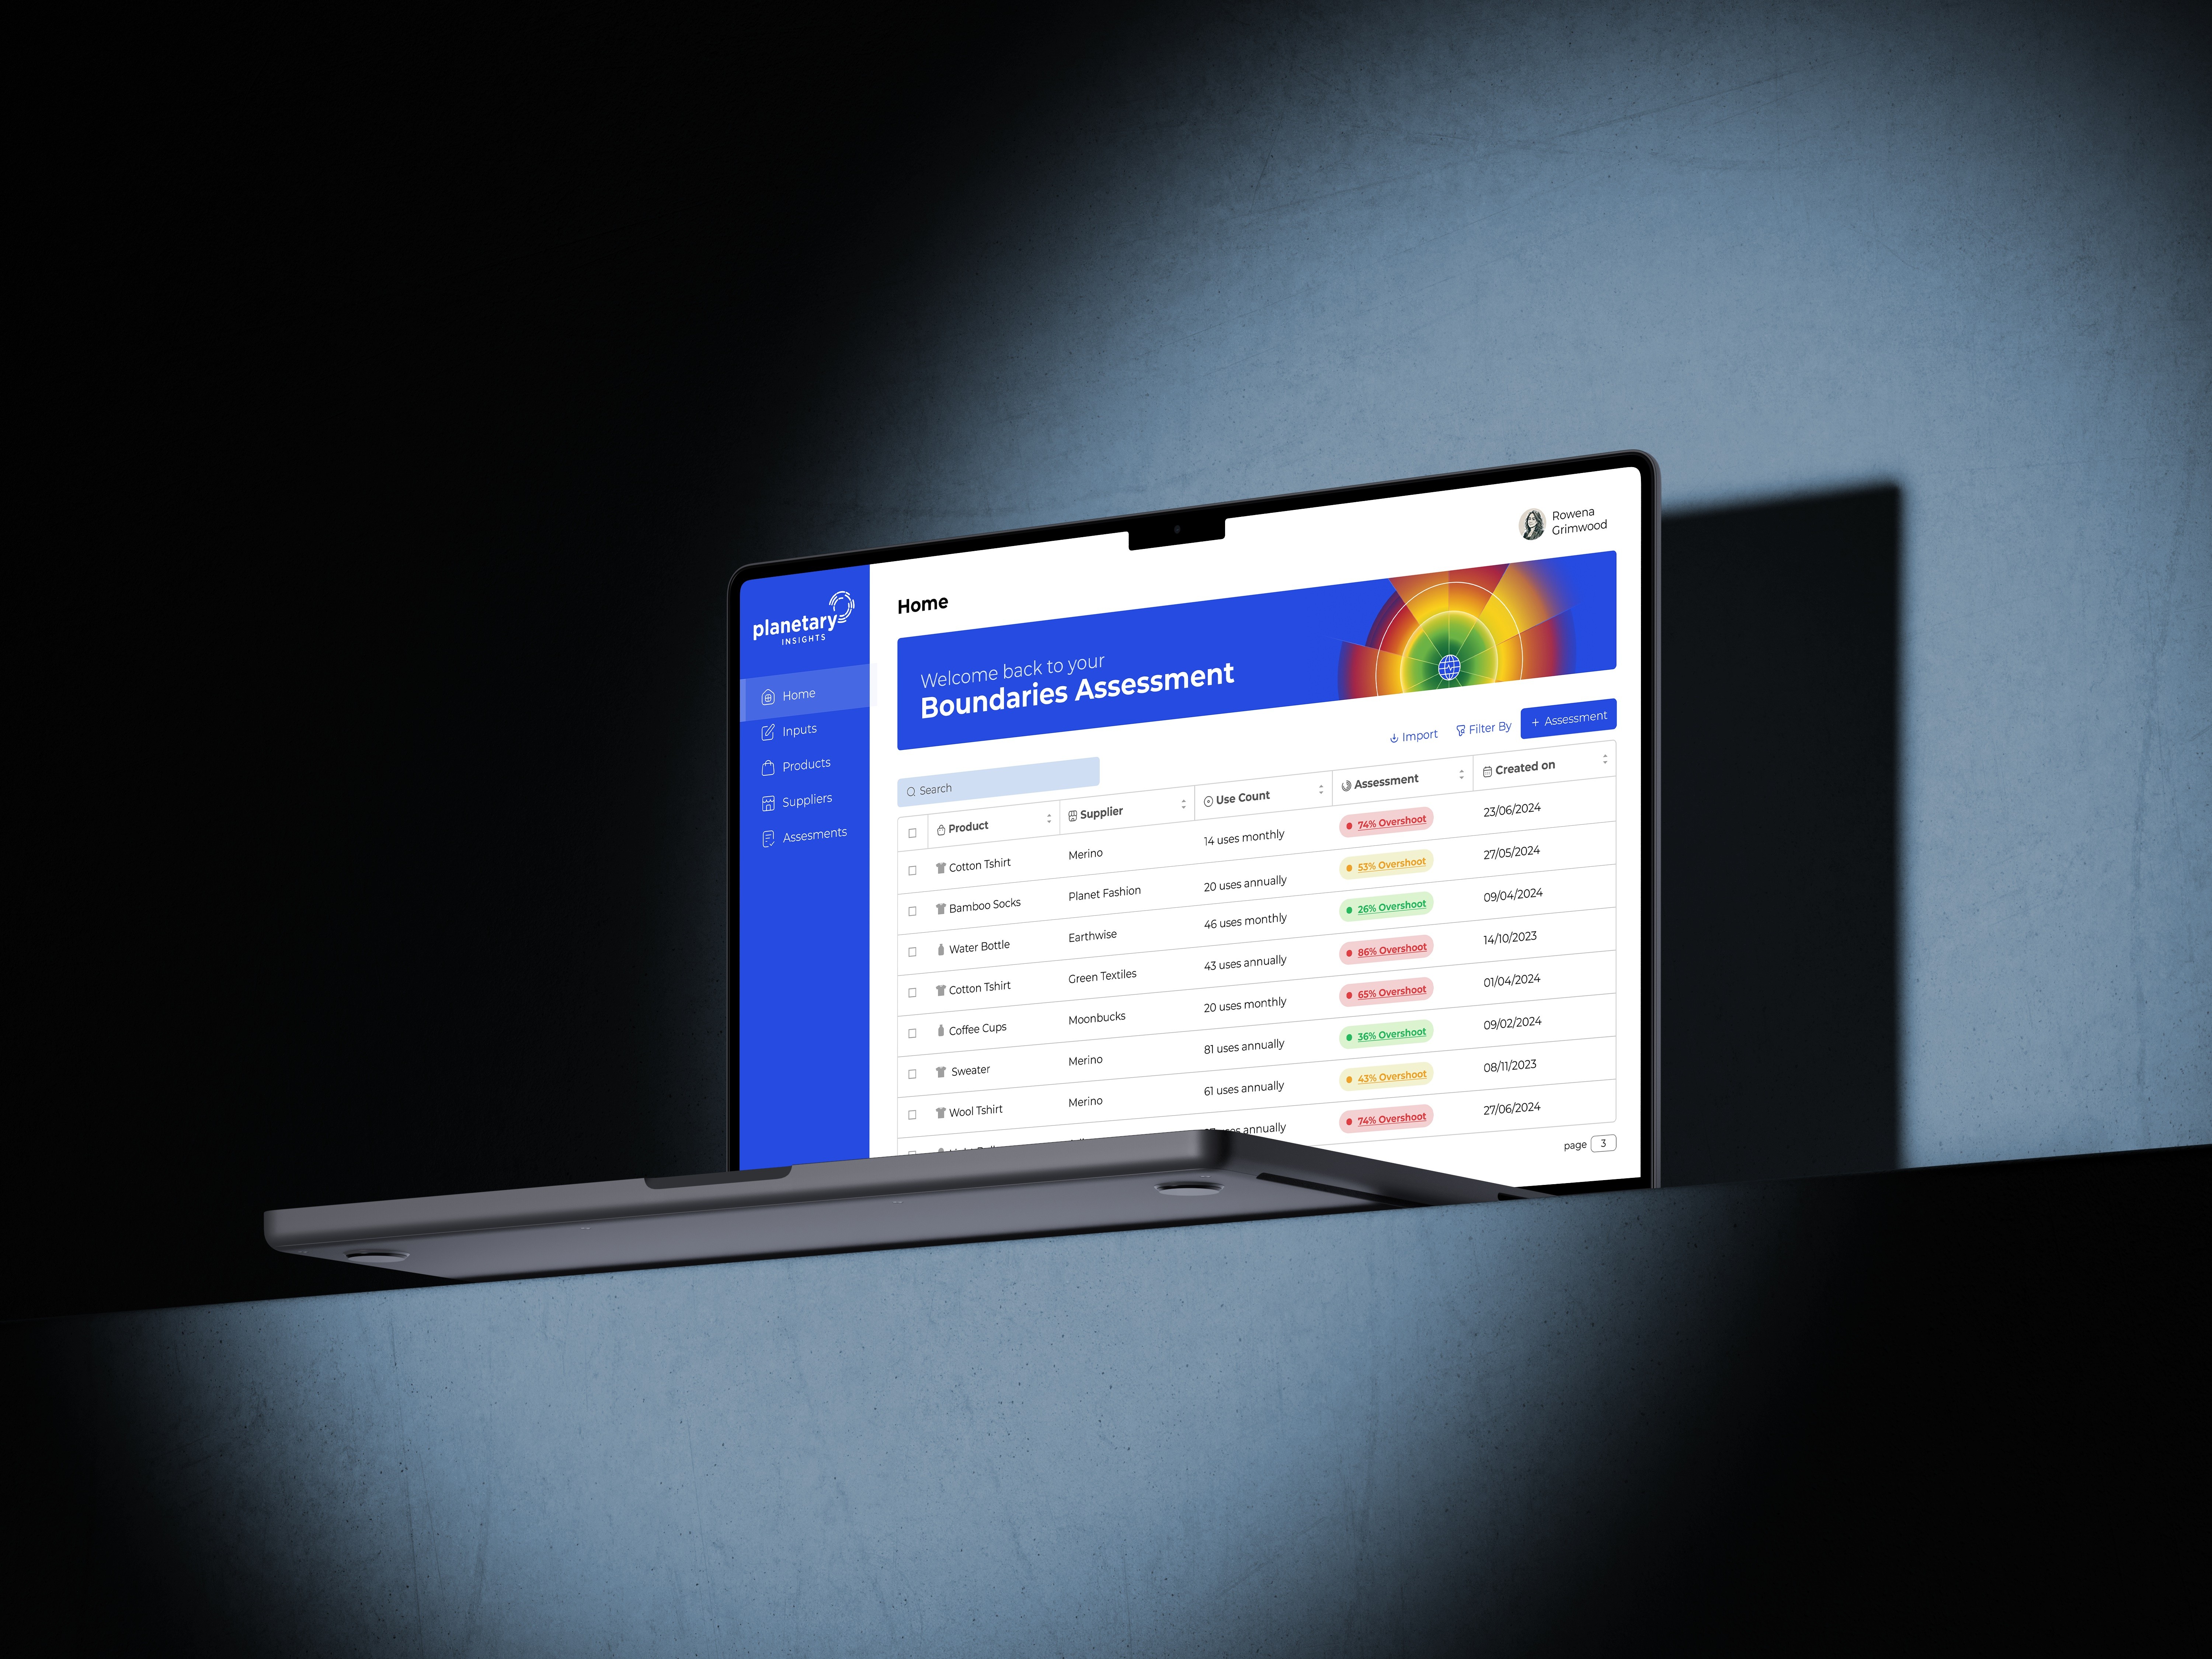
▲ Updated User Interface
01
Global Status
I replaced the tiny radar chart with a prominent "Planetary Label" visualization. This became the hero of the page, instantly showing users which boundaries (e.g., Nitrogen, Water) were in "Overshoot."


02
Unified Dashboard
I consolidated the fragmented charts. Now, "Processes" (e.g., Dyeing, Knitting) are stacked directly beside their environmental impact, allowing users to see exactly which step in the supply chain is causing the damage.
03
Contextual Data Entry
I introduced a Step-by-Step guide. Instead of overwhelming the user with 50 fields, the system groups inputs logically (Materials -> Processes -> Transport), reducing cognitive load.

The Design System
" height="99px" id="y6i28XhWk" transform="translate(-8 -8)" width="99px"/><path d="M 35.373 5.791 C 35.358 5.776 32.424 8.68 26.582 14.515 L 22.482 10.414 L 31.216 1.675 C 26.6 -1.101 20.687 -0.369 16.887 3.448 C 13.908 6.427 12.742 10.768 13.826 14.839 L 13.911 15.163 L 0.225 28.853 C -0.075 29.153 -0.075 29.644 0.225 29.944 L 7.052 36.775 C 7.351 37.075 7.844 37.075 8.142 36.775 L 21.82 23.089 L 22.144 23.176 C 26.215 24.268 30.559 23.102 33.538 20.118 C 37.344 16.32 38.098 10.426 35.372 5.791 Z" fill="rgb(255, 255, 255)" height="37px" id="H4DuDpeci" transform="translate(23 23)" width="37px"/></svg>)
Semantic Data Palette
I defined a strict color logic for the charts (Green=Safe, Yellow=Risk, Red=Overshoot) to ensure instant data recognition across all screens.
Atomic Component
I built reusable input fields, table rows, and status badges. This dramatically speeds up future development and ensures that a "dropdown" looks the same on the Dashboard as it does in Settings.


01
65% Faster Assessmen
I reduced the average time to complete a full product assessment from 8 minutes to under 3 minutes by unifying the disconnected input forms and result charts into a single, intuitive view.
02
96% Success Rate
In validation testing, nearly all participants completed complex data entry tasks without critical errors—a massive improvement from the 58% success rate observed in the original interface.
03
4.8/5 User Satisfaction
User sentiment scores more than doubled. Rising from a poor 2.1/5 to an excellent 4.8/5—as the redesign eliminated the confusion that plagued the original interface.


" height="49px" id="LIGo47a1Z" transform="translate(17 17)" width="49px"/></svg>)